
Just recently the government released the final numbers for key data about how the oil and gas industry rebounded in 2016. The overall picture is good, and there’s reason to be optimistic for the months to come.
The rig count data is courtesy of Baker Hughes Inc., employment data is from the Bureau of Labor statistics, production numbers and crude oil spot prices were provided by the and all the rest came from the Energy Information Administration.
We’re going to take a look at 2016 by the numbers, and break down the most important statistics and trends in the energy industry last year.
Last Year’s Monthly Rig Count
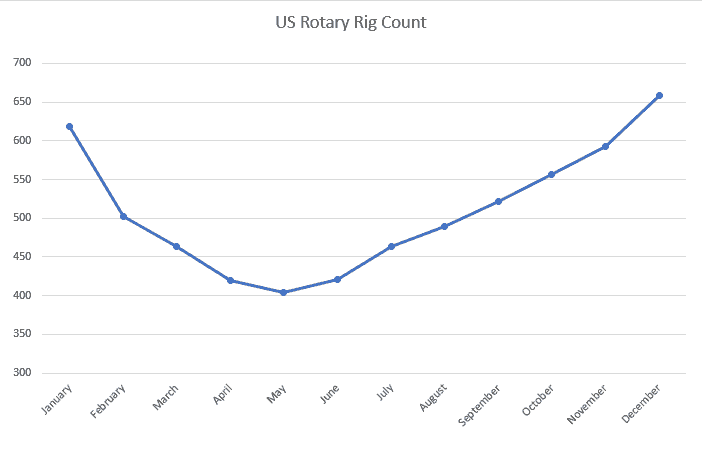
Nothing shows off the details of the oil recovery quite like the Baker-Hughes rig count. You can clearly see the trend that defined the whole year. There was a sharp decline through the spring, things began to turn around in the summer, and we ended the year slightly better than where we started it.
Rig counts tend to be a leading indicator in the industry. Companies bring new rigs online a few months before they expect to need the output in order to give themselves time to get them into full production.
You’ll see that the same general trendline holds for the rest of the data, but the turnaround is more pronounced in the rig count since the metric is so much more forward-looking.
Overall Domestic Production
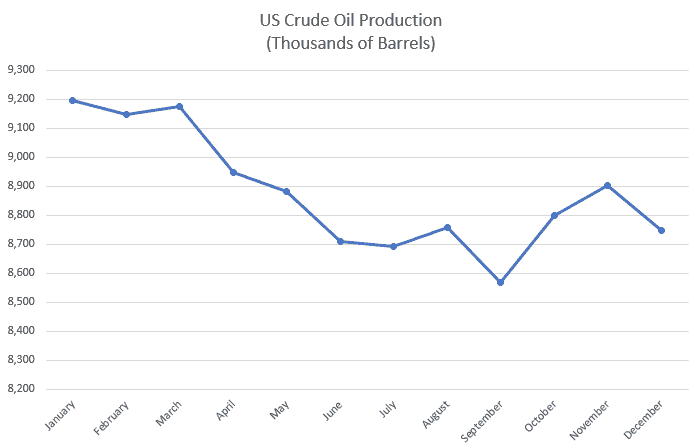
Domestic oil production clearly stopped its plunge in June, but falling winter demand made its recover a bit shaky. Look for increased production heading into late spring of 2017 as this trend firms up and seasonal demand takes hold.
In conjunction with the current volume of oil reserves, seasonal demand can act on the trend line in ways that seem to pull it out of sync with other indicators. Domestic production generally lags the rig count and leads oil and gas employment.
The Price of West Texas Crude
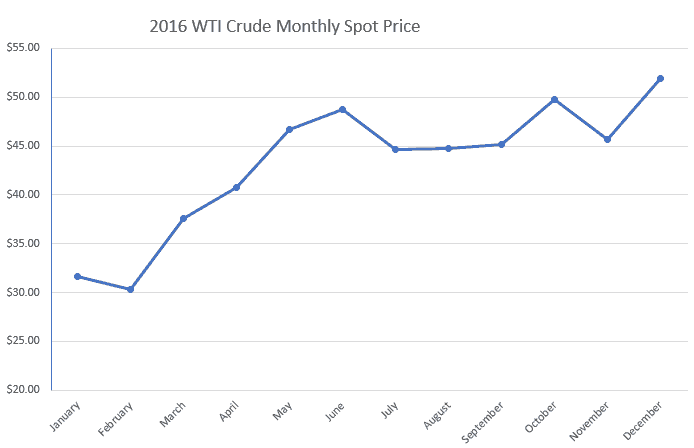
When you look at the price of West Texas crude, it’s no surprise why the industry began to turn around over the summer. After a disastrous start to the year, increasing demand coupled with talk of an OPEC deal began to shore up prices. A deal between Russia and OPEC’s member countries was reached on November 30th, and the year ended on a high note.
Although it’s easy to think of oil prices as the biggest overall leading indicator, they tend to lag global demand and reserve volume.
Oil and Gas Industry Employment
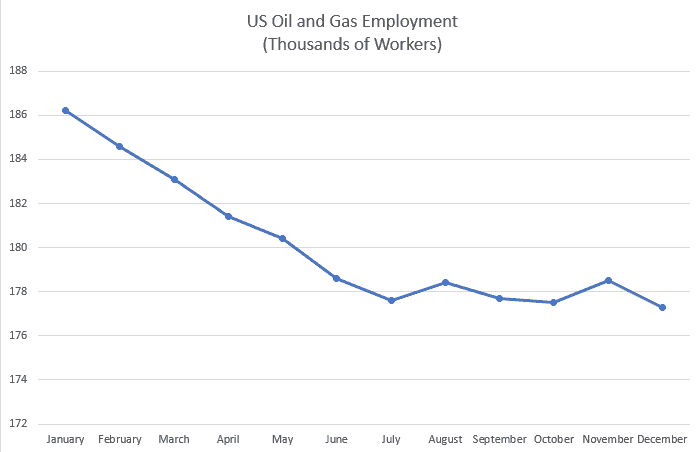
If rig count is a leading indicator, then unfortunately employment is a lagging one. Although oil and gas employment numbers stopped their dramatic fall in July, they didn’t really recover last year either. In total, an additional 80,000 jobs were lost in the oil and gas sector in 2016, bringing the count up to about 155,000 layoffs since 2014.
Fortunately for oilfield workers, there’s every indication that 2017 is going to be a year for recovery. As shown above, oil producers have been steadily bringing their rigs back online for a few months now. As prices rise and more rigs come online, energy companies will be hiring crews to man the rigs.
Although it’s not very likely that every job lost in 2016 will be replaced in 2017, it’s not out of the question to see a solid recovery of 35,000 – 50,000 jobs in the oilfields and refineries this year. Companies working the Bakken play are already hiring, and Conoco has been making noise about bringing on more workers in Northern Alaska.
Looking at Price and Rig Counts
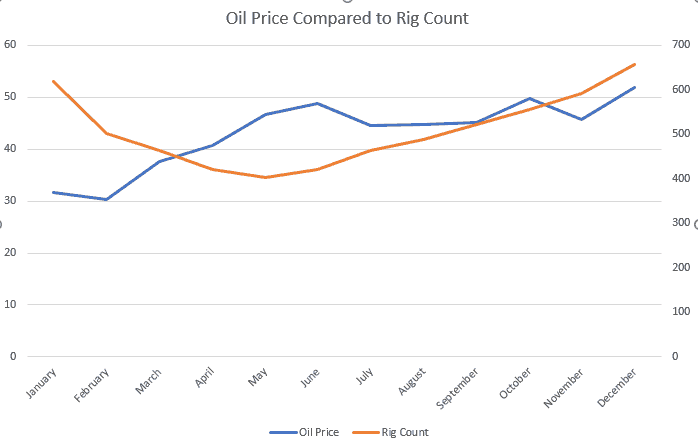
Looking at the overall rig count is the easiest way to get a ballpark figure of production capacity, so it makes sense that the count would correlate strongly with the price of oil. As prices rise, energy producers bring mothballed rigs back online so they have the capability to ramp up production when it’s profitable to do so.
It’s important to remember that bringing a rig online is a process, and even when a rig is in production mode it isn’t necessarily running at full capacity. A lot of the rigs that were brought online after October are only now getting up to speed.
Unlike the relationship between employment and production below, falling prices won’t drag the rig count lower immediately, even if the margin increases by quite a bit. The reason for this is that it costs oil companies money to take rigs offline, and if they feel the price decreases are temporary it makes more sense to wait and see.
If you look at the margin between the two trend lines, you’ll see this in action for yourself. It took three months of rising prices before oil producers were sure enough that the price of oil would hold before they brought additional rigs into service.
Employment and Production Numbers
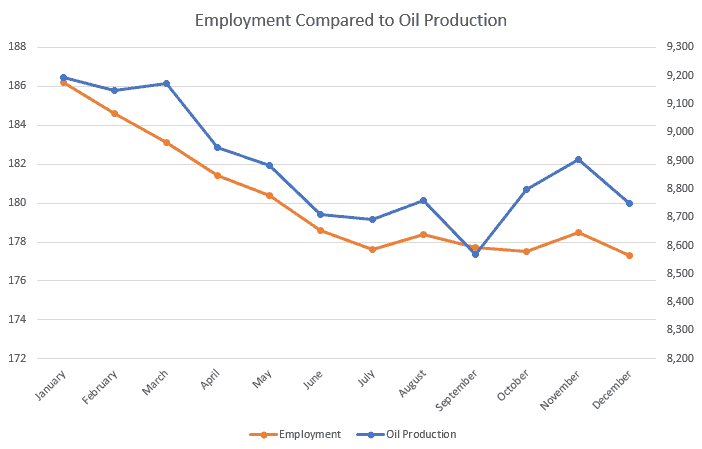
Similar to the correlation that we see between price and rig count, employment and production go hand in hand. When companies are hiring workers, they’re producing more oil. In this case it’s not about establishing capacity, it’s all about real production. Oil companies don’t hire crews to sit around and do nothing.
As the margin between production and employment increases, the likelihood of hiring grows. Look for production to drag employment upwards as we approach the summer of 2017.