


These interactive presentations contain the latest oil & gas production data from 114,539 horizontal wells in 12 US states, through June 2019. Cumulative oil and gas production from these wells reached 11.7 billion bbl and 133.7 Tcf of natural gas. West Virginia is deselected in most dashboards, as it has a greater reporting lag. Oklahoma is for now only available in our subscription services.
Oil production from horizontal wells in these states increased slightly in June, to around 7 million bo/d (after upcoming revisions). That would represent a growth of 100 thousand bo/d in the first 6 months, far lower than the ~670 thousand bo/d increase in the same period last year, but still positive.
As is visualized in the chart above, total oil production in June can be divided into 3 roughly equal parts: the contribution from wells that began production in the first 6 months since year (dark blue), the ones that started last year (light blue), and all the wells that came online before 2018 (all other colors).
Natural gas production also set a new record (switch “Product” to gas), at 64 Bcf/d.
In the “Well quality” tab, you can easily see how well productivity has changed in the major tight oil basins. Results have steadily improved since 2008, but markedly slower after 2017. Normalized for lateral length (which is possible in our advanced analytics service), and averaged for all the oil wells in these basins, we see no clear improvement since 2016.
EOG is by far the largest operator of tight oil wells (see “Top operators”), producing almost double the numbers 2 to 5. However, its production dropped by almost 8% in June, from which it somewhat recovered in July (based on preliminary data, not visible here).
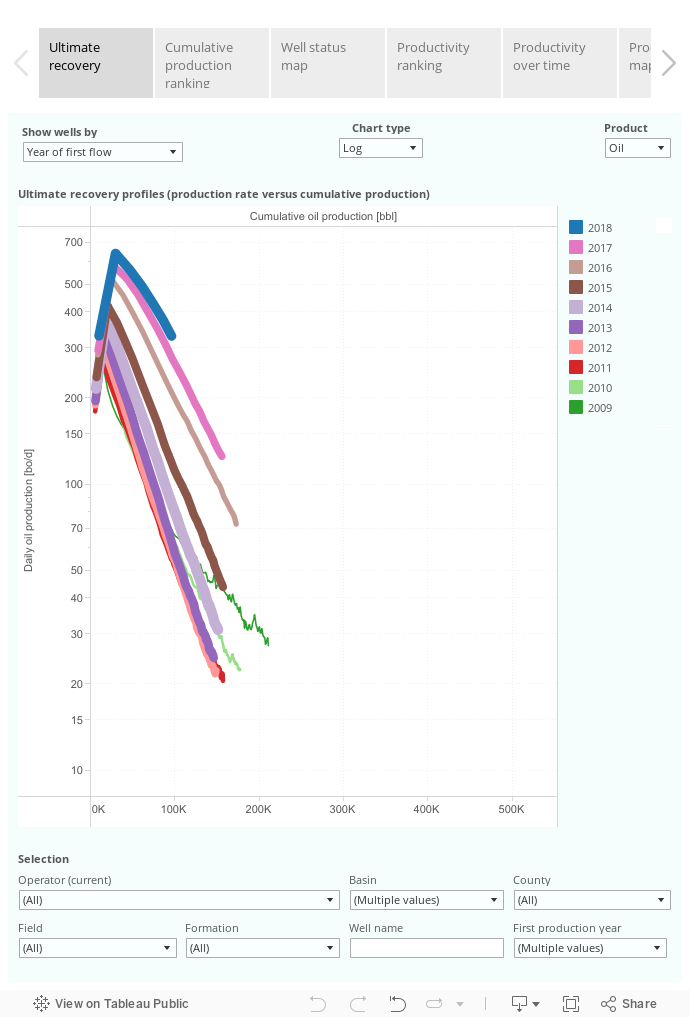
This “Ultimate recovery” overview shows the relationship between production rates and cumulative production over time. The oil basins are preselected and the wells are grouped by the year in which production started.
The 2nd tab (“Cumulative production ranking”), ranks all counties by cumulative oil production. McKenzie County is shown here in the top spot. Since 2005 more than 1 billion barrels of oil have been produced in this county from horizontal wells, and production is still above half a million bo/d. Lea, Midland, Reeves and Weld are also close to this production rate.
In the following overview (taken from our ShaleProfile Analytics service (Professional)) you can see how well productivity has evolved in each of these 5 counties.
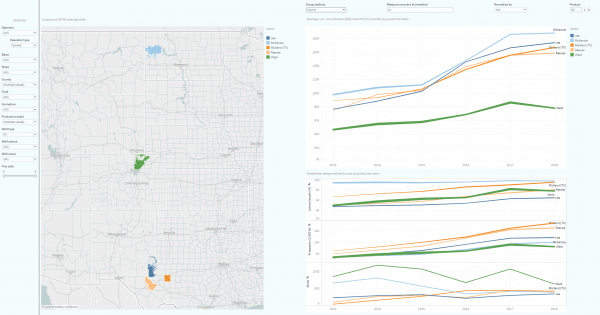
The chart on the top-right shows the average cumulative oil production in the first year on production, by production start date, for each of these counties. It clearly shows that based on this metric, McKenzie is still the most productive area. If you normalize for lateral length in this dashboard, Lea is clearly outperforming the other areas. That probably explains why you can now find the most rigs drilling horizontal wells in Lea County, based on the latest rig count (65, vs. 53 in Reeves and just 18 in McKenzie).
The charts below it reveal that McKenzie also has the longest laterals, while in Midland most proppant is used.
Early next week we will have a new post on North Dakota. Production data through July, in which another production record was set, is already available in our subscription services since last week.
Production data is subject to revisions. For these presentations, I used data gathered from the sources listed below.
- FracFocus.org
- Arkansas Oil & Gas Commission
- Colorado Oil & Gas Conservation Commission
- Louisiana Department of Natural Resources. Similar to Texas, lease/unit production is allocated over wells in order to estimate their individual production histories.
- Montana Board of Oil and Gas
- New Mexico Oil Conservation Commission
- North Dakota Department of Natural Resources
- Ohio Department of Natural Resources
- Pennsylvania Department of Environmental Protection
- Texas Railroad Commission. Individual well production is estimated through the allocation of lease production data over the wells in a lease, and from pending lease production data.
- Utah Division of Oil, Gas and Mining
- Automated Geographic Reference Center of Utah.
- West Virginia Department of Environmental Protection
- West Virginia Geological & Economic Survey
- Wyoming Oil & Gas Conservation Commission
====BRIEF MANUAL====
The above presentations have many interactive features:
- You can click through the blocks on the top to see the slides.
- Each slide has filters that can be set, e.g. to select individual or groups of operators. You can first click “all” to deselect all items. You have to click the “apply” button at the bottom to enforce the changes. After that, click anywhere on the presentation.
- Tooltips are shown by just hovering the mouse over parts of the presentation.
- You can move the map around, and zoom in/out.
- By clicking on the legend you can highlight selected items.
- Note that filters have to be set for each tab separately.
- The operator who currently owns the well is designated by “operator (current)”. The operator who operated a well in a past month is designated by “operator (actual)”. This distinction is useful when the ownership of a well changed over time.
- If you have any questions on how to use the interactivity, or how to analyze specific questions, please don’t hesitate to ask.